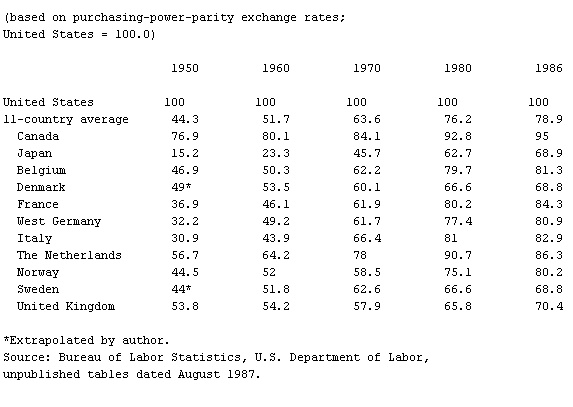
Real Gross Domestic Product per Employed Person, Table 1
Table
(based on purchasing-power-parity exchange rates;
United States = 100.0)
1950 1960 1970 1980 1986
United States 100 100 100 100 100
11-country average 44.3 51.7 63.6 76.2 78.9
Canada 76.9 80.1 84.1 92.8 95
Japan 15.2 23.3 45.7 62.7 68.9
Belgium 46.9 50.3 62.2 79.7 81.3
Denmark 49* 53.5 60.1 66.6 68.8
France 36.9 46.1 61.9 80.2 84.3
West Germany 32.2 49.2 61.7 77.4 80.9
Italy 30.9 43.9 66.4 81 82.9
The Netherlands 56.7 64.2 78 90.7 86.3
Norway 44.5 52 58.5 75.1 80.2
Sweden 44* 51.8 62.6 66.6 68.8
United Kingdom 53.8 54.2 57.9 65.8 70.4
*Extrapolated by author.
Source: Bureau of Labor Statistics, U.S. Department of Labor,
unpublished tables dated August 1987.
- Charles-Adolphe Wurtz
- Charles Albert
- Charles Albert Bender
- Charles-Albert Gobat
- Charles-Alexandre de Calonne
- Charles-Alexandre Dupuy
- Charles Alfred Pillsbury
- Charles A. Lindbergh
- Charles-Alphonse Du Fresnoy
- Charles-Amédée de Savoie, Duke de Nemours
- Charles-Amédée de Savoie Nemours, Duke de
- Charles Ancillon
- Charles; and Eames Eames, Ray
- Charles; and Eames, Ray Eames
- Charles; and Fontaine Percier, Pierre (-François-Léonard)
- Charles; and Fontaine, Pierre (-François-Léonard) Percier
- Charles-André, Count Pozzo di Borgo
- Charles-André Pozzo di Borgo, Count
- Charles-André Van Loo
- Charles Anthony Johnson
- Charles-Antoine Coypel
- Charles, Archduke
- Charles Atlas
- Charles Atwood Kofoid
- Charles-Auguste de Bériot