Real Gross Domestic Products of Selected OECD Countries, Table 3
Table
Table I. Real Gross Domestic Products of Selected OECD Countries
% annual change
Country 1993 1994 1995 1996 19971
United States 2.3 3.5 2.0 2.4 3.6
Japan 0.3 0.6 1.4 3.6 0.9
Germany -1.1 2.9 1.9 1.4 2.4
France -1.3 2.8 2.1 1.5 2.3
Italy -1.2 2.2 2.9 0.7 1.2
Great Britain 2.1 3.8 2.5 2.1 3.5
Canada 2.2 4.1 2.3 1.5 3.5
All developed countries 1.2 2.9 2.2 2.6 3.0
Seven major countries above 1.0 2.8 2.0 2.3 2.9
European Union -0.5 2.9 2.4 1.6 2.5
See as table: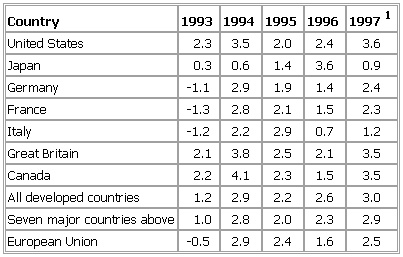
1Estimated.
Sources: OECD; The Economist.
- Accius, Lucius
- acclimatization
- accompaniment
- accomplice
- Accoramboni, Vittoria
- accordion
- accounting
- account payable
- account receivable
- Accra
- acculturation
- Accursius, Franciscus
- accused, rights of
- AC/DC
- Ace, Goodman
- Aceh
- Acehnese
- Acehnese War
- acervulus
- Acestes
- Acetabularia
- acetaldehyde
- acetaminophen
- acetanilide
- acetic acid