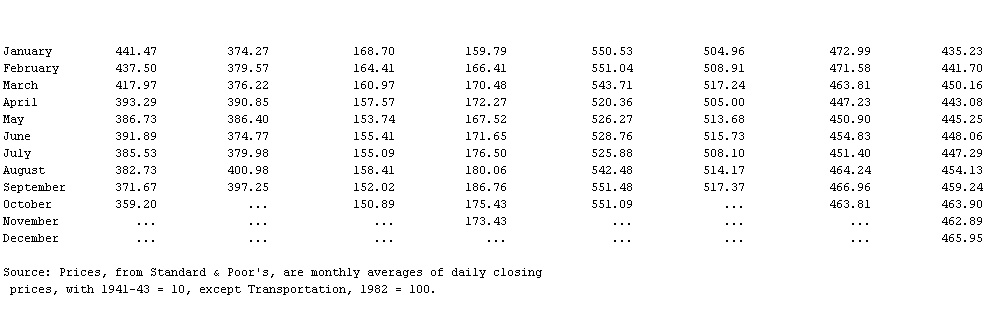
U.S. Stock Market Prices, Table 1
Table
Public
Transportation utilities Industrials Composite
(20 stocks) (40 stocks) (400 stocks) (500 stocks)
Month 1994 1993 1994 1993 1994 1993 1994 1993
January 441.47 374.27 168.70 159.79 550.53 504.96 472.99 435.23
February 437.50 379.57 164.41 166.41 551.04 508.91 471.58 441.70
March 417.97 376.22 160.97 170.48 543.71 517.24 463.81 450.16
April 393.29 390.85 157.57 172.27 520.36 505.00 447.23 443.08
May 386.73 386.40 153.74 167.52 526.27 513.68 450.90 445.25
June 391.89 374.77 155.41 171.65 528.76 515.73 454.83 448.06
July 385.53 379.98 155.09 176.50 525.88 508.10 451.40 447.29
August 382.73 400.98 158.41 180.06 542.48 514.17 464.24 454.13
September 371.67 397.25 152.02 186.76 551.48 517.37 466.96 459.24
October 359.20 ... 150.89 175.43 551.09 ... 463.81 463.90
November ... ... ... 173.43 ... ... ... 462.89
December ... ... ... ... ... ... ... 465.95
Source: Prices, from Standard & Poor's, are monthly averages of daily closing
prices, with 1941-43 = 10, except Transportation, 1982 = 100.
- Betpaqdala
- betrothal
- Bet Sheʾan
- Bet Sheʿarim
- Betsileo
- Betsimisaraka
- Betsy Rawls
- Betsy Ross
- Bette Davis
- Bettelheim, Bruno
- Better Business Bureau
- Betterton-Kroll process
- Betterton, Thomas
- Bettiah
- Betti, Enrico
- Bettina von Arnim
- Bettino Craxi
- Betti, Ugo
- Betty; and Green, Adolph Comden
- Russell
- Russell Alan Hulse
- Russell Baker
- Russell Banks
- Russell, Bertrand
- Russell, Bill