World Cotton Production and Consumption, Table 3
Table
Table X. World Cotton Production and Consumption
In 000,000 480-lb bales
Region and country 1995-96 1996-971 1997-982
Production 93.0 89.1 90.2
Western Hemisphere 24.1 23.9 24.8
United States 17.9 18.9 18.8
Brazil 1.8 1.3 1.8
Europe 2.2 1.8 2.1
Former Soviet republics 8.3 6.5 7.6
Uzbekistan 5.7 4.8 5.5
Africa 6.7 7.4 8.1
Asia and Oceania 51.7 49.5 47.6
China 21.9 19.3 18.0
India 13.2 13.8 12.9
Pakistan 8.2 7.3 7.7
Consumption 86.9 88.4 89.8
United States 10.6 11.1 11.4
China 20.6 21.0 21.5
India 11.9 11.9 13.2
Pakistan 7.2 7.0 7.0
European Union 5.1 5.2 5.2
Southeast Asia 4.5 4.5 4.3
Turkey 4.4 4.6 4.7
See as table: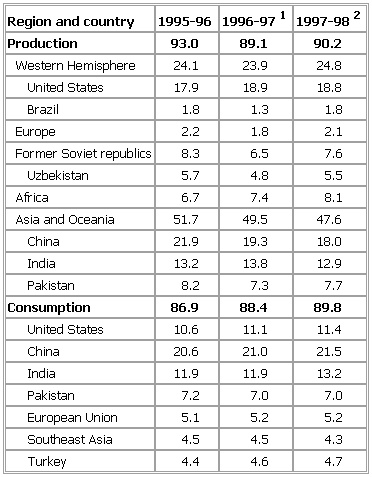
1Estimated.
2Forecast.
Source: USDA, October and November 1997.
- Channel Country
- channeling
- Channel Islands
- Channel Tunnel
- Channel–Port aux Basques
- Channing, Edward
- Channing, Walter
- Channing, William Ellery
- Chan painting
- chanson
- chanson de geste
- Chanson de Roland, La
- chanson de toile
- chanson à personnages
- Chantal, Saint Jane Frances of
- chantefable
- Chanthaburi
- Chanthakuman
- Chantilly
- Chantilly lace
- Chantilly porcelain
- Chantrey, Sir Francis Legatt
- chant royal
- chantry
- Chanute