World Green Coffee Production, Table 1
Table
Table VIII. World Green Coffee Production
In 000,000 60-kg bags
Region and country 1994–95 1995–961 1996–972
North America 17.2 18.2 18.5
Costa Rica 2.5 2.6 2.6
El Salvador 2.3 2.3 2.4
Guatemala 3.5 3.5 3.5
Honduras 2.3 2.3 2.5
Mexico 4.0 4.5 4.7
South America 46.1 34.6 45.5
Brazil 28.0 16.8 27.5
Colombia 13.0 12.5 13.0
Ecuador 2.6 2.2 2.2
Peru 1.5 1.8 1.4
Africa 18.2 17.6 18.2
Cameroon 1.0 1.2 1.0
Côte d'Ivoire 3.7 2.8 3.2
Ethiopia 3.8 3.8 3.9
Kenya 1.6 1.6 1.7
Uganda 3.1 3.4 3.2
Zaire 1.3 1.0 1.2
Asia and Oceania 16.3 16.4 16.8
India 3.1 3.5 3.2
Indonesia 6.0 5.8 6.5
Thailand 1.4 1.3 1.3
Vietnam 3.5 3.4 3.5
Total production 97.7 86.8 99.1
Exportable 75.1 63.7 74.8
Beginning stocks 30.8 36.8 29.2
Exports3 69.7 71.6 76.8
See as table: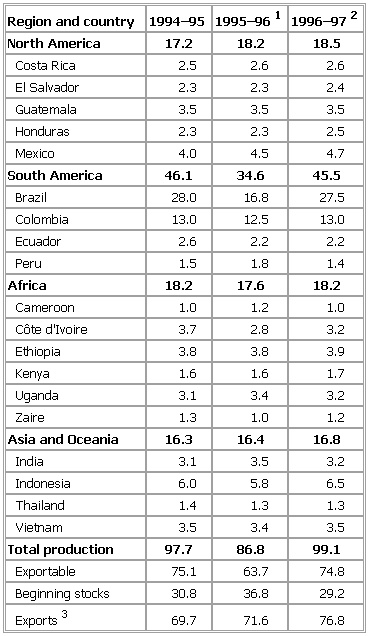
1Preliminary. 2Forecast. 3By exporting countries.
Source: USDA, June 1996.
- Byrd, Richard E.
- Byrds, the
- Byrd, William
- Byrd, William, of Westover
- Byrhtferth of Ramsey
- Byrne, Barry
- Byrnes, James F.
- Byrom, John
- Byron Bay
- Byron, George Gordon Byron, 6th Baron
- Byron, John
- Byron, John Byron, 1st Baron
- Byron Nelson
- Byron R. White
- byssinosis
- byte
- Bytom
- Byzantine architecture
- Byzantine art
- Byzantine chant
- Byzantine emperors*
- Byzantine Empire
- Byzantine Greek language
- Byzantine rite
- Byzantium