World Production of Centrifugal Sugar, Table
Table
In 000,000 metric tons raw value
Region and country 1992-93 1993-94 1994-95{1}
North America 11.6 10.9 11.6
United States 7.1 7.0 7.4
Mexico 4.3 3.8 4.0
 Caribbean 5.4 5.1 4.3
 Cuba 4.3 4.0 3.2
Central America 2.3 2.5 2.5
Guatemala 1.1 1.2 1.2
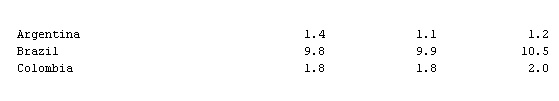
South America 15.5 15.4 16.2
Argentina 1.4 1.1 1.2
Brazil 9.8 9.9 10.5
Colombia 1.8 1.8 2.0
 Europe 21.6 22.3 19.9
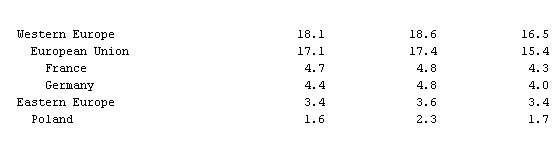
 Western Europe 18.1 18.6 16.5
European Union 17.1 17.4 15.4
France 4.7 4.8 4.3
Germany 4.4 4.8 4.0
Eastern Europe 3.4 3.6 3.4
Poland 1.6 2.3 1.7
 Former Soviet republics{2} 7.1 7.5 6.3
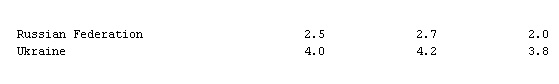
 Russian Federation 2.5 2.7 2.0
Ukraine 4.0 4.2 3.8
 Africa and Middle East 10.0 9.8 10.8
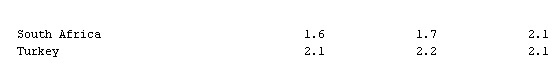
 South Africa 1.6 1.7 2.1
Turkey 2.1 2.2 2.1
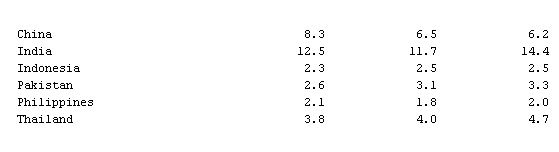
 Asia 33.7 31.9 35.4
 China 8.3 6.5 6.2
India 12.5 11.7 14.4
Indonesia 2.3 2.5 2.5
Pakistan 2.6 3.1 3.3
Philippines 2.1 1.8 2.0
Thailand 3.8 4.0 4.7
 Oceania 4.8 5.0 5.5
 Australia 4.4 4.5 5.0
Totals
Beginning stocks 23.6 21.0 17.6
As % of consumption 20.6% 18.5% 15.4%
Production 112.0 110.2 112.6
Imports{3} 29.5 29.7 27.9
Consumption 114.6 113.7 113.8
Exports{3} 29.5 29.7 27.9
{1}Preliminary.
{2}Includes Estonia, Latvia, and Lithuania.
{3}Exports do not equal imports because "Totals" are a composite of slightly differing
marketing years, not all beginning in the same months.
Source: USDA, Foreign Agricultural Service, November 1994.

- robbery
- Robbins, Frederick Chapman
- Robbins, Jerome
- Robbins, Lionel Charles Robbins, Baron
- Robbins, Tom
- Robecchi-Bricchetti, Luigi
- Robert
- Robert, 1st Baron Clive of Plassey Clive
- Robert, 1st earl of Orford Walpole
- Roberta Bondar
- Robert Adam
- Robert Adams
- Robert A Heinlein
- Robert Aldrich
- Robert Allston
- Robert Almer Harper
- Robert Altman
- Robert A.M. Stern
- Robert A. Mundell
- Robert; and Colling, Charles Colling
- Robert; and Colling Colling, Charles
- Robert; and Lynd, Helen Lynd
- Robert; and Lynd Lynd, Helen
- Robert Andrews Millikan
- Robert Armin