World Production of Centrifugal Sugar, Table 3
Table
In 000,000 metric tons raw value
Region and country 1993-94 1994-95 1995-96{1}
North America 10.8 11.9 11.3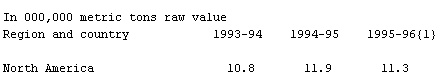
United States 6.9 7.2 6.9
Mexico 3.8 4.6 4.2
 Caribbean 5.1 4.2 5.0
 Cuba 4.0 3.3 4.0
Central America 2.4 2.6 2.8
Guatemala 1.1 1.3 1.3
South America 15.5 18.3 19.2
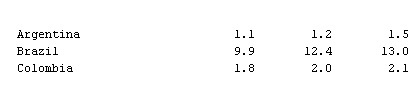
Argentina 1.1 1.2 1.5
Brazil 9.9 12.4 13.0
Colombia 1.8 2.0 2.1
 Europe 22.1 19.6 20.6
 Western Europe 18.6 16.6 17.1
European Union 18.4 16.5 17.0
France 4.7 4.4 4.6
Germany 4.7 4.0 4.2
Eastern Europe 3.5 3.0 3.5
Poland 2.2 1.5 1.8
 Former Soviet republics{2} 7.5 5.7 6.4
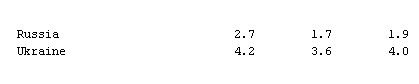
 Russia 2.7 1.7 1.9
Ukraine 4.2 3.6 4.0
 Africa and Middle East 9.8 10.2 10.2
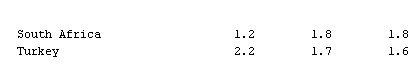
 South Africa 1.2 1.8 1.8
Turkey 2.2 1.7 1.6
 Asia 31.8 37.4 36.9
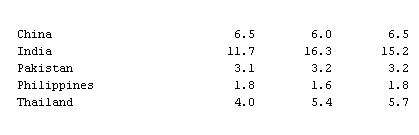
 China 6.5 6.0 6.5
India 11.7 16.3 15.2
Pakistan 3.1 3.2 3.2
Philippines 1.8 1.6 1.8
Thailand 4.0 5.4 5.7
 Oceania 4.9 5.7 5.5
 Australia 4.4 5.1 5.0
Totals
Beginning stocks 21.1 18.4 19.4
As % of consumption 18.8% 16.1% 16.6%
Production 109.8 115.6 118.0
Imports{3} 30.0 30.5 31.3
Consumption 112.5 114.5 116.6
Exports{3} 30.0 30.5 31.3
{1}Preliminary.
{2}Includes Estonia, Latvia, and Lithuania.
{3}Exports may not equal imports because "Totals" are a composite
of slightly differing marketing years, not all beginning in
the same months.
Source: USDA, Foreign Agricultural Service, November 1995.

- Amud
- Amu Darya
- amulet
- Amundsen Gulf
- Amundsen, Roald
- Amur
- Amur River
- Amursk
- Amuzgo
- Amy Clampitt
- amygdule
- Amy Johnson
- amyl alcohol
- amylase
- amyl nitrite
- amyloidosis
- Amy Lowell
- Amy Marcy Beach
- Amyntas III (or II)
- Amyot, Jacques
- amyotrophic lateral sclerosis
- Amy Tan
- Amy Vanderbilt
- Amália da Piedade Rebordão Rodrigues
- Amédée Ozenfant