World Production of Major Oilseeds and Products, Table 2
Table
Table IV. World Production of Major Oilseeds and Products
In 000,000 metric tons
1994–95 1995–961 1996–972
Total production of oilseeds 260.7 255.4 256.3
Soybeans 137.8 124.3 133.7
U.S. 68.5 59.2 63.8
China 16.0 13.5 13.3
Argentina 12.6 12.6 13.5
Brazil 25.9 23.2 26.0
Cottonseed 32.9 35.2 33.4
U.S. 6.9 6.2 6.5
Former Soviet republics 3.7 3.3 3.2
China 7.7 8.4 6.6
Peanuts 26.3 25.9 26.4
U.S. 1.9 1.6 1.6
China 9.7 10.2 9.8
India 8.4 7.4 8.2
Sunflower seed 23.4 25.8 23.8
U.S. 2.2 1.8 1.5
Former Soviet republics 4.4 7.4 5.3
Argentina 5.6 5.6 5.0
European Union 4.1 3.2 3.8
Rapeseed 30.3 34.5 29.8
Canada 7.2 6.4 5.0
China 7.5 9.7 9.0
European Union 7.3 8.3 6.9
India 5.5 6.2 6.0
Copra 5.5 5.0 5.1
Palm kernel 4.5 4.8 5.0
Oilseeds crushed 207.2 215.7 213.5
Soybeans 109.9 111.6 113.0
Oilseed ending stocks 26.9 22.3 21.3
Soybeans 23.5 17.2 18.0
World production 3
Total fats and oils 82.0 85.2 86.5
Edible vegetable oils 67.5 70.4 71.9
Soybean oil 19.7 20.1 20.4
Palm oil 14.8 15.6 16.4
Animal fats 13.0 13.4 13.4
Marine oils 1.5 1.4 1.2
High-protein meals4 136.0 139.3 138.4
Soybean meal 87.2 88.6 89.1
Fish meal 10.3 9.8 9.2
See as table: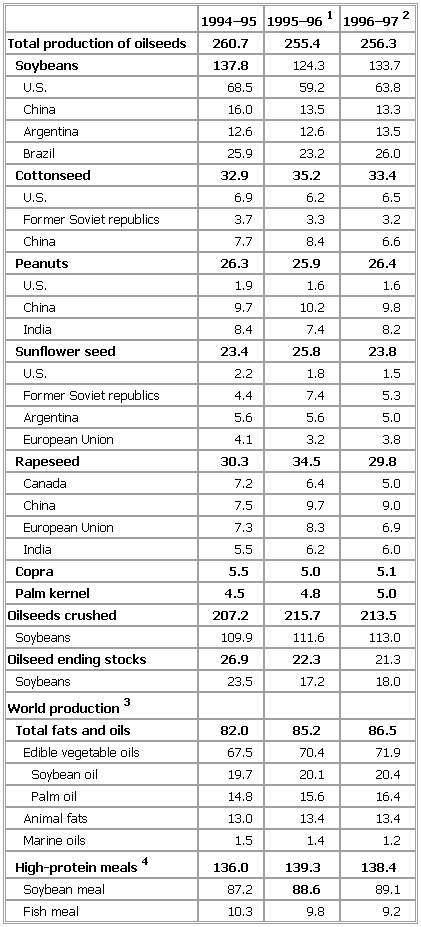
1Preliminary. 2Forecasting. 3Processing potential from crops
in year indicated. 4Converted, on the basis of product's protein
content, to weight equivalent of soybeans of 44% protein content.
Source: USDA, November 1996.