World Production of Milk, Table 2
Table
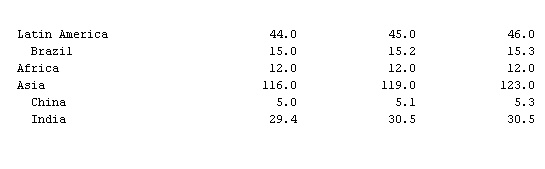
In 000,000 metric tons
Region and country 1992 1993{1} 1994{2}
Developed countries 354.0 348.0 342.0
United States 68.8 68.5 69.4
Canada 7.6 7.5 7.7
Europe 161.0 158.0 155.0
European Union 112.4 111.6 110.2
France 25.3 25.0 24.9
Germany 28.1 28.2 27.8
Italy 11.3 10.8 10.3
Netherlands, The 10.9 10.9 10.8
United Kingdom 14.4 14.5 14.4
Other Western Europe{3} 12.8 12.9 13.0
Eastern Europe
Poland 13.1 12.7 12.5
Romania 3.8 3.5 3.5
Former Soviet republics
Russian Federation 47.2 46.9 44.0
Ukraine 19.1 18.1 17.5
Australia/New Zealand{4} 15.5 16.6 17.9
Japan 8.6 8.6 8.5
 Less developed countries 172.0 177.0 181.0
 Latin America 44.0 45.0 46.0
Brazil 15.0 15.2 15.3
Africa 12.0 12.0 12.0
Asia 116.0 119.0 123.0
China 5.0 5.1 5.3
India 29.4 30.5 30.5
 World total 526.0 525.0 526.0
 {1}Preliminary.
{2}Forecast.
{3}Austria, Finland, Sweden, and Switzerland.
{4}Year ending June 30 for Australia and May 31 for New Zealand.
Sources: FAO,  Food Outlook, November/December 1994; USDA, Foreign Agricultural
Food Outlook, November/December 1994; USDA, Foreign Agricultural Service, August 1994.
- Armenian Catholic Church
- Armenian chant
- Armenian Highland
- Armenian language
- Armenian literature
- Armenian massacres
- Armenian rite
- Armentières
- Armfelt, Gustaf Mauritz
- Armidale
- Armillaria
- armillary sphere
- Ramses II
- Ramses III
- Ramses IV
- Ramses IX
- Ramses V
- Ramses VI
- Ramses VII
- Ramses VIII
- Ramses X
- Ramses XI
- Ramsey
- Ramsey, Michael, Baron Ramsey Of Canterbury
- Ramsey, Norman Foster