Nutrient composition of selected vegetables and vegetable products
Table
Nutrient composition of selected vegetables and vegetable products (per 100 g)*
vegetable or
vegetable
product energy (kcal) water
(g) carbohy-
drate (g) vitamin C (mg) thiamin
(mg) riboflavin (mg) niacin (mg) vitamin A (IU) fat (g) protein (g)
asparagus, canned 14 94.63 2.25 16.4 0.054 0.089 0.851 474 0.19 1.80
asparagus,
raw 23 92.40 4.54 13.2 0.140 0.128 1.170 583 0.20 2.28
cabbage,
raw 25 92.15 5.43 32.2 0.050 0.040 0.300 133 0.27 1.44
carrots,
raw 43 87.79 10.14 9.3 0.097 0.059 0.928 28,129 0.19 1.03
Chinese cabbage, raw 13 95.32 2.18 45.0 0.040 0.070 0.500 3,000 0.20 1.50
corn, sweet,
raw 86 75.96 19.02 6.8 0.200 0.060 1.700 281 1.18 3.22
corn on the
cob, frozen 98 71.79 23.50 7.2 0.103 0.088 1.681 246 0.78 3.28
lettuce, iceberg, raw 13 95.89 2.09 3.9 0.046 0.030 0.187 330 0.19 1.01
peas, green, frozen 77 79.93 13.70 18.0 0.258 0.100 1.707 727 0.37 5.21
peas, green,
raw 81 78.86 14.46 40.0 0.266 0.132 2.090 640 0.40 5.42
potato chips 536 1.90 52.90 31.1 1.167 0.197 3.827 0 34.60 7.00
potatoes, mashed,
dry flakes 354 6.51 81.21 83.6 1.031 0.110 6.146 0 0.39 8.35
potatoes,
raw 79 78.96 17.98 19.7 0.088 0.035 1.484 0 0.10 2.07
tomato juice, canned 17 93.90 4.23 18.3 0.047 0.031 0.673 556 0.06 0.76
tomatoes,
red, ripe 21 93.76 4.64 19.1 0.059 0.048 0.628 628 0.33 0.85
tomatoes,
sun-dried 258 14.56 55.76 39.2 0.528 0.489 9.050 874 2.97 14.11
*Values shown are approximations; actual nutrient composition can vary greatly depending on such factors as growing conditions, time of harvest, and storage.
Source: U.S. Department of Agriculture, Composition of Foods, Agriculture Handbook no. 8-11.
See as table: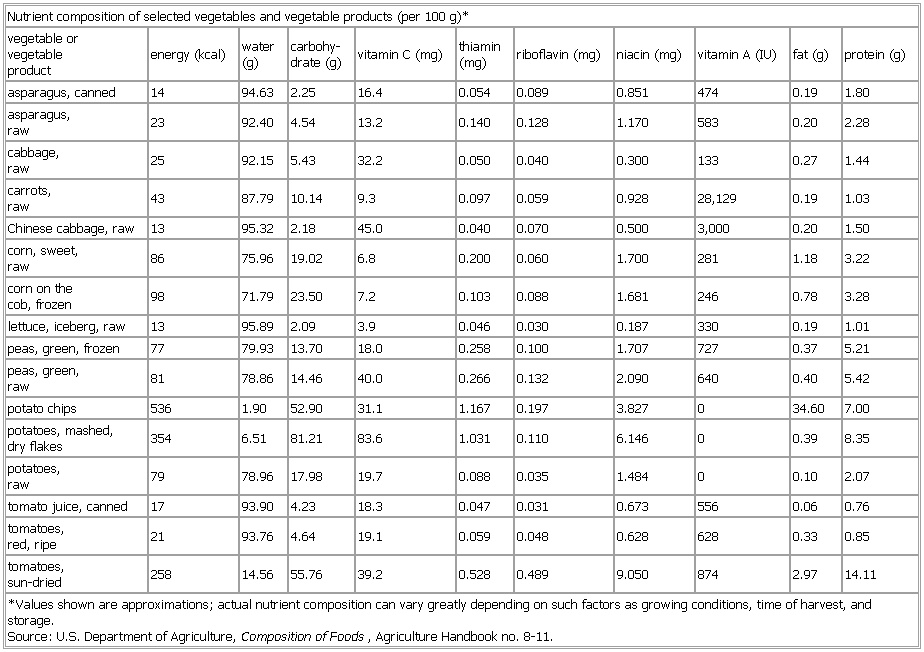
- Maxwell Bodenheim
- Maxwell-Boltzmann distribution law
- Maxwell Davenport Taylor
- Maxwell, Elsa
- Maxwell Fry
- Maxwell, Gavin
- Maxwell, James Clerk
- Maxwell Montes
- Maxwell Perkins
- Maxwell, Robert
- Maxwell's demon
- Maxwell's equations
- Maxwell, William
- Max Wertheimer
- Max Wladimir, Baron von Beck
- Max Wladimir Beck, Baron von
- Max Wolf
- May
- Maya
- maya
- Maya Angelou
- Maya Chiburdanidze
- Maya Deren
- Mayagüez
- Mayakovsky, Vladimir Vladimirovich