Pattern of Output, 1990-93, Table
Table
Percent change from previous year
Developed Less developed
World{1} countries countries
1990 1991 1992 1993 1990 1991 1992 1993 1990 1991 1992 1993
All manufacturing 0 -1 -1 0 -1 -2 -2 -1 5 4 4 6
Heavy industries 0 -1 -1 1 -1 -2 -2 0 6 4 5 8
Base metals -2 -3 -2 0 -3 -4 -3 -2 4 3 2 7
Metal products 0 -2 -3 0 -1 -2 -3 -1 8 6 5 10
Building materials, etc. -1 -2 0 0 -2 -5 -2 -1 3 6 4 4
Chemicals -1 0 3 1 -2 -1 2 0 5 3 6 6
Light industries -1 0 0 -1 -2 -1 0 -2 3 3 2 4
Food, drink, tobacco 1 2 1 1 0 1 0 -1 4 4 3 4
Textiles -5 -2 -1 -2 -8 -4 -2 -4 2 1 1 3
Clothing, footwear -6 -4 -3 -2 -7 -6 -4 -3 -1 1 0 2
Wood products -1 -2 1 2 -2 -3 1 1 5 5 3 6
Paper, printing 2 1 0 -1 2 0 -1 -2 5 5 4 5
{1}Excluding Albania, China, North Korea, Vietnam, former Czechoslovakia, former Soviet Union, and former Yugoslavia.
Source: UN, 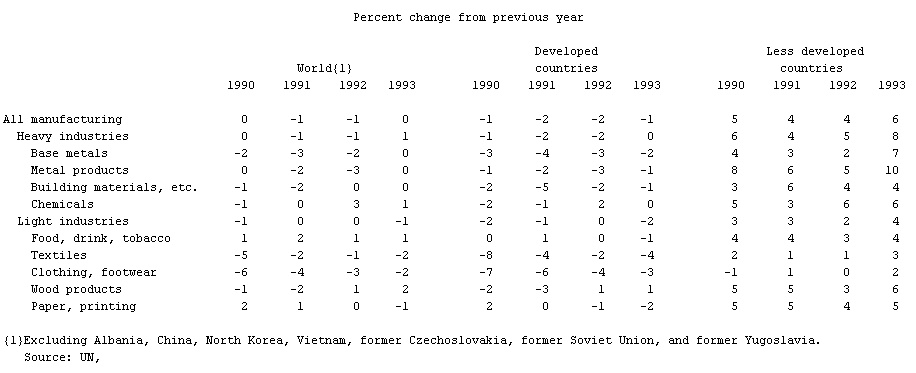 Monthly Bulletin of Statistics.
Monthly Bulletin of Statistics. - Volterra, Vito
- voltmeter
- Volturno River
- Voltzia
- Volubilis
- volume, and average depth of oceans and seas Surface area
- volume Surface area, and average depth of oceans and seas
- volumetric analysis
- voluntarism
- Volunteers of America
- volute
- Volvo Aktiebolaget
- volvocid
- Volvox
- volvulus
- Volyn-Podilsk Upland
- Volzhsky
- Vom
- vomiting
- Vonck, Jean-François
- Vondel, Joost van den
- von Gierke's disease
- Vo Nguyen Giap
- von Hügel, Friedrich, Baron Von Hügel
- Vonnegut, Kurt, Jr.