Pattern of Output, 1991-94, Table
Table
Percent change from previous year
Developed Less developed
World{1} countries countries
1991 1992 1993 1994 1991 1992 1993 1994 1991 1992 1993 1994
All manufacturing -1 -1 0 5 -2 -2 -1 4 4 4 5 5
Heavy industries -1 -1 0 5 -2 -2 0 5 4 4 6 6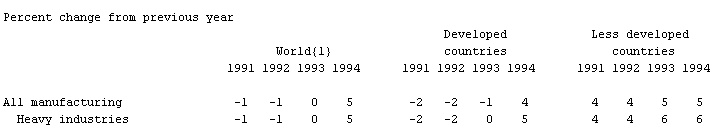
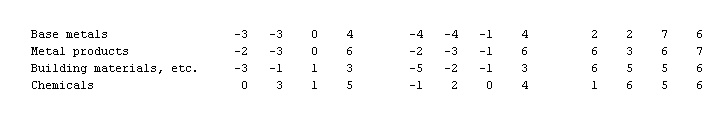
Base metals -3 -3 0 4 -4 -4 -1 4 2 2 7 6
Metal products -2 -3 0 6 -2 -3 -1 6 6 3 6 7
Building materials, etc. -3 -1 1 3 -5 -2 -1 3 6 5 5 6
Chemicals 0 3 1 5 -1 2 0 4 1 6 5 6
 Light industries 0 0 -1 3 -1 -1 -2 3 4 3 3 4
Food, drink, tobacco 2 1 0 3 1 0 -1 2 4 3 3 4
Textiles -2 -1 -2 1 -4 -2 -4 0 2 1 3 3
Clothing, footwear -4 -3 -2 0 -6 -4 -4 -1 1 0 2 3
Wood products -2 1 1 4 -3 0 1 3 5 3 2 5
Paper, printing 0 0 -1 4 0 -1 -2 4 5 3 5 3
{1}Excluding Albania, China, North Korea, Vietnam, former Czechoslovakia, former Soviet Union, and former Yugoslavia.
Source: UN, 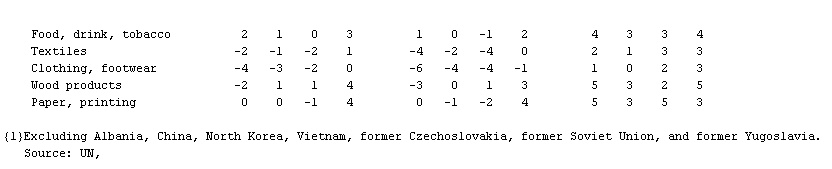 Monthly Bulletin of Statistics.
Monthly Bulletin of Statistics.