Real Gross Domestic Products of Selected OECD Countries, Table 2
Table
% annual change
Country 1990 1991 1992 1993 1994{1}
United States 1.2 -0.7 2.6 3.0 4.0
Japan 4.8 4.3 1.1 0.1 0.8
Germany{2} 5.7 4.5 2.1 -1.3 2.0
France 2.5 0.8 1.2 -0.9 1.8
United Kingdom 0.4 -2.2 -0.6 1.9 3.8
Canada -0.2 -1.7 0.7 2.4 4.0
Italy 2.1 1.2 0.7 -0.7 2.0
All developed countries 2.5 0.8 1.7 1.2 2.7
Seven major countries above 2.4 0.8 1.7 1.3 2.8
European Union 3.0 1.5 1.0 -0.4 2.0
{1}Estimated. {2}From 1991, figures include former East Germany.
Sources: International Monetary Fund, OECD, 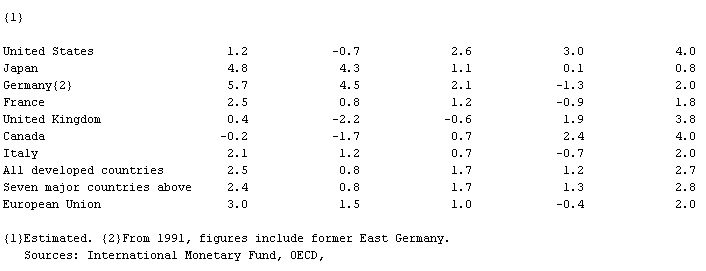 The Economist.
The Economist. - Naidu, Sarojini
- nail
- nailhead
- nail-patella syndrome
- Naima, Mustafa
- Naim Suleymanoglu
- Nainital
- Naipaul, Sir V.S.
- naira
- Nair, Mira
- Nairne, Carolina Nairne, Baroness
- Nairnshire
- Nairobi
- Nairobi National Park
- Naismith, James A.
- Naivasha, Lake
- Najaf, Al-
- Najd
- Najibullah, Mohammad
- Najin
- Najrān
- Najāḥid Dynasty
- Najʿ Ḥammādī
- Nakae Chōmin
- Nakae Tōju