Real Gross Domestic Products of Selected OECD Countris, Table
Table
Table I. Real Gross Domestic Products of Selected OECD Countries
% annual change
Country 1992 1993 1994 1995 19961
United States 2.7 2.2 3.5 2.0 2.3
Japan 1.1 0.1 0.5 0.9 3.5
Germany2 2.2 -1.2 2.9 1.9 1.5
France 1.2 -1.3 2.8 2.2 1.1
United Kingdom -0.5 2.3 3.8 2.4 2.3
Canada 0.8 2.2 4.6 2.2 1.6
Italy 0.7 -1.2 2.2 3.0 0.9
All developed countries 1.8 1.0 2.7 1.9 2.2
Seven major countries above 1.8 1.0 2.8 1.9 2.0
European Union 1.0 -0.6 2.7 2.5
See as table: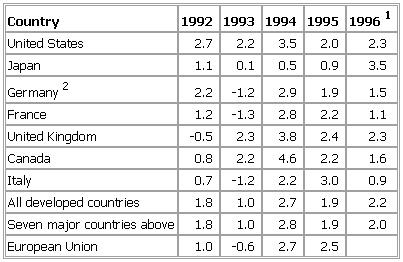
1Estimated. 2From 1992, figures include former East Germany.
Sources: OECD, The Economist.
- Manfalūṭī, Muṣṭafā Luṭfī al-
- Manfred
- Manfred Eigen
- Manfred, Freiherr von Richthofen
- Manfred J. Sakel
- Manfred Lachs
- Manfredo Fanti
- Manfredonia
- Manfred Richthofen, Freiherr von
- mangabey
- Mangaia
- Mangalore
- Manganelli, Giorgio
- manganese
- manganese processing
- Mangang
- manganite
- Mangan, James Clarence
- Mangas Coloradas
- Mangbetu
- mange
- Mangelsdorff, Albert
- Manggarai
- Mangiarotti, Edoardo
- Mangla Dam