Catch Trends for the Top 10 Caught Species in 2000
Table
(in metric tons)
Percent
change
1998 1999 2000 from 1999
Anchoveta (Peruvian anchovy) 1,729,064 8,723,265 11,276,357 29.27
Alaska pollock (walleye pollock) 4,049,223 3,362,473 3,024,796 -10.04
Atlantic herring 2,422,136 2,403,835 2,370,020 -1.41
Skipjack tuna 1,888,856 1,988,276 1,890,133 -4.94
Japanese anchovy 2,093,888 1,820,259 1,725,685 -5.20
Chilean jack mackerel 2,025,758 1,423,447 1,540,494 8.22
Largehead hairtail 1,436,303 1,419,404 1,479,848 4.26
Chub mackerel 1,924,623 1,946,268 1,455,796 -25.20
Capelin 985,498 904,799 1,455,795 60.90
Blue whiting (poutassou) 1,185,003 1,318,628 1,419,911 7.68
See as table: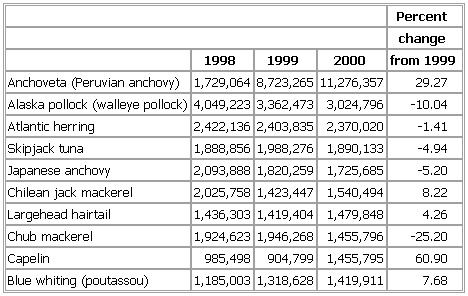
Source: Food and Agriculture Organization.
- Raven, Simon
- Ravidas
- Ravinia Park
- Ravi Shankar
- Rawalpindi
- Rawlings, Jerry J.
- Rawlings, Marjorie Kinnan
- Rawlins
- Rawlinson, Sir Henry Creswicke
- Rawls, Betsy
- Rawls, John
- Rawls, Lou
- Raw materials used in the manufacture of portland cement
- Rawson
- Rawsthorne, Alan
- ray
- Ray Bradbury
- Ray Brown
- Rayburn, Sam
- Ray C. Ewry
- Ray Charles
- Ray, Charlotte E.
- Ray Dandridge
- Ray Eames, Charles; and Eames
- Ray, James Earl