World Fisheries, 1991*, Table
Table
Catch Trade
in 000 metric tons in $000,000
Country Total Inland Imports Exports
China 13,135.0 5,528.1 438.1 1,182.0
Japan 9,306.8 204.0 12,043.6 839.2
U.S.S.R. 9,216.9 1,030.8 162.3 837.2
Peru 6,944.2 30.0 1.0 491.1
Chile 6,002.9 6.8 5.9 1,066.9
U.S. 5,473.3 275.0 5,997.8 3,279.3
India 4,036.9 1,700.8 -- 570.3
Indonesia 3,186.0 806.0 47.4 1,192.1
Thailand 3,065.2 270.0 1,050.0 2,901.4
South Korea 2,515.3 30.4 568.2 1,490.6
Philippines 2,311.8 612.4 96.1 467.7
Norway 2,095.9 0.5 307.0 2,282.2
Denmark 1,793.2 36.5 1,148.2 2,302.3
North Korea 1,700.1 100.0 -- 61.4
Canada 1,529.8 50.3 675.2 2,169.1
Mexico 1,429.1 171.4 46.7 393.5
Spain 1,350.0 29.2 2,748.3 772.6
Iceland 1,050.4 0.8 14.0 1,280.0
Bangladesh 892.7 258.9 -- 178.9
Vietnam 877.0 267.0 -- 112.8
United Kingdom 830.6 19.2 1,911.9 1,121.9
France 812.8 46.0 2,926.0 925.6
Brazil 800.0 214.4 180.8 157.4
Myanmar (Burma) 769.2 175.2 -- 26.2
Argentina 640.6 10.6 16.8 448.0
Malaysia 620.0 14.5 170.5 264.9
New Zealand 609.0 1.3 37.1 460.8
Morocco 592.9 1.4 1.2 608.9
Italy 548.2 56.7 2,689.6 249.0
Pakistan 515.5 115.9 -- 110.4
South Africa 498.9 2.3 143.4 140.5
Poland 457.4 48.0 37.4 188.7
The Netherlands 443.1 4.1 977.4 1,356.2
Tanzania 400.3 345.0 -- --
Ecuador 383.6 2.4 5.8 587.6
Ghana 365.0 57.0 31.3 15.9
Turkey 364.6 47.2 24.8 61.0
Venezuela 352.8 21.3 4.6 89.5
Portugal 325.3 2.6 757.8 287.2
Senegal 319.7 17.6 38.6 233.4
Germany 300.2 46.8 2,114.7 716.0
Egypt 298.0 215.9 73.2 11.0
Iran 277.4 82.4 12.2 83.7
Nigeria 266.6 90.9 191.5 15.6
Other 7,221.7 2,129.6 5,850.0 6,498.4
World 96,925.9 15,177.2 43,546.4 38,528.4
*Excludes aquatic mammals, crocodiles and alligators, pearls,
corals, sponges, and aquatic plants.
Source: United Nations Food and Agriculture Organization,
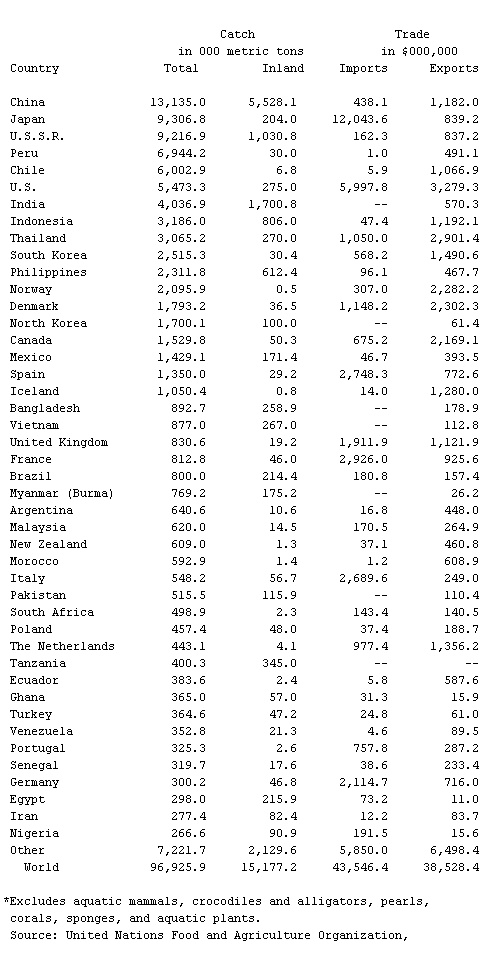 Yearbook of Fishery Statistics, vols. 72 and 73.
 - Bend
- Benda, František
- Benda, Georg
- bendahara
- Benda, Julien
- Benda, Wladyslaw Theodor
- Bender, Charles Albert
- Bendigo
- Bendis
- Bendix Corporation
- Bendix, Vincent
- Bene Beraq
- Benedek, Ludwig August, Ritter von
- Beneden, Edouard van
- Beneden, Pierre-Joseph van
- Benedetti, Mario
- Benedetti, Vincent, Comte
- Benedetto Antelami
- Benedetto Cairoli
- Benedetto Croce
- Benedetto da Maiano
- Benedetto Marcello
- Benedetto Zaccaria
- Benedict Arnold
- Benedict Augustin Morel