World Production of Major Oilseeds and Products, Table
Table
In 000,000 metric tons
1992-93 1993-94{1} 1994-95{2}
Production of oilseeds 227.3 226.9 251.3
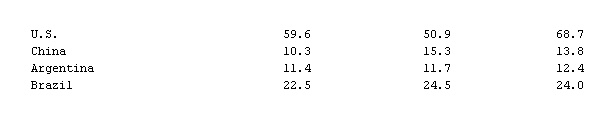
Soybeans 117.1 116.6 132.9
U.S. 59.6 50.9 68.7
China 10.3 15.3 13.8
Argentina 11.4 11.7 12.4
Brazil 22.5 24.5 24.0
 Cottonseed 31.6 29.5 32.8
 U.S. 5.7 5.8 6.9
Former Soviet republics 3.7 3.8 3.8
China 7.7 6.4 7.7
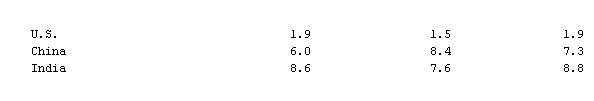
 Peanuts 23.1 24.0 24.5
 U.S. 1.9 1.5 1.9
China 6.0 8.4 7.3
India 8.6 7.6 8.8
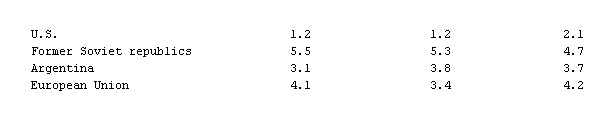
 Sunflower seed 21.3 21.0 22.4
 U.S. 1.2 1.2 2.1
Former Soviet republics 5.5 5.3 4.7
Argentina 3.1 3.8 3.7
European Union 4.1 3.4 4.2
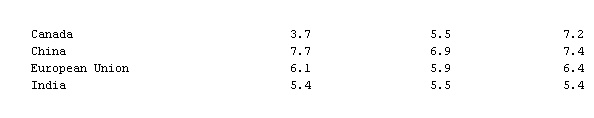
 Rapeseed 25.3 26.8 29.4
 Canada 3.7 5.5 7.2
China 7.7 6.9 7.4
European Union 6.1 5.9 6.4
India 5.4 5.5 5.4
 Copra 4.8 4.8 5.0
 Palm kernel 4.0 4.3 4.3
Oilseeds crushed 183.6 186.8 197.6
Soybeans 96.2 99.7 104.9
Oilseed ending stocks 23.2 19.6 28.8
Soybeans 20.2 17.0 24.9
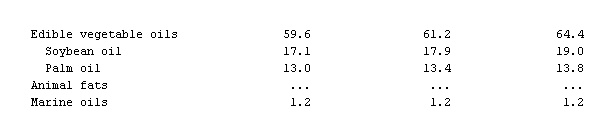
World production{3}
Total fats and oils ... ... ...
Edible vegetable oils 59.6 61.2 64.4
Soybean oil 17.1 17.9 19.0
Palm oil 13.0 13.4 13.8
Animal fats ... ... ...
Marine oils 1.2 1.2 1.2
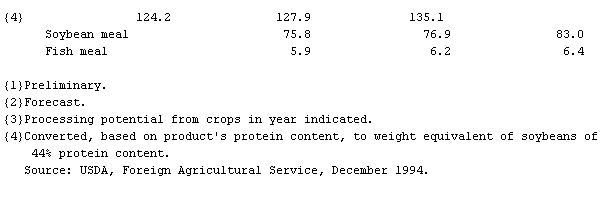
 High-protein meals{4} 124.2 127.9 135.1
 Soybean meal 75.8 76.9 83.0
Fish meal 5.9 6.2 6.4
{1}Preliminary.
{2}Forecast.
{3}Processing potential from crops in year indicated.
{4}Converted, based on product's protein content, to weight equivalent of soybeans of
44% protein content.
Source: USDA, Foreign Agricultural Service, December 1994.
- Ptolemy XIV Theos Philopator II
- Ptolemy XV Caesar
- ptosis
- p'u
- puberty
- pubic louse
- public administration
- publican
- Public Broadcasting Service
- public debt
- public defender
- Public Enemy
- public enterprise
- public health
- public health dentistry
- public house
- public opinion
- public relations
- Public Safety, Committee of
- public school
- public utility
- Public Works Administration
- Public Works of Art Project
- Publilius Syrus
- publishing, history of