Real Gross Domestic Product per Economically Active Person, Table
Table
(1950, 1970, and 1980 in 1975 international dollars and
average annual percentage rates of change)
1950 1970 1980 1950-70 1970-80
Developing market economies 1,176 2,252 3,004 3.3 2.9
Low-income countries 566 813 880 1.8 0.8
Middle-income countries 1,296 2,539 3,432 3.4 3.1
Oil exporters 1,338 3,120 4,341 4.3 3.4
Relatively industrialized 2,347 4,765 6,839 3.6 3.7
Other 981 1,691 2,094 2.8 2.2
Industrial countries 5,951 10,590 13,723 2.9 2.6
Centrally planned economies 1,422 2,935 3,488 3.7 1.7
World 2,327 4,383 5,493 3.2 2.3
Source: Irving B. Kravis and Robert E. Lipsey, "The Diffusion of Economic
Growth in the World Economy, 1950-80," 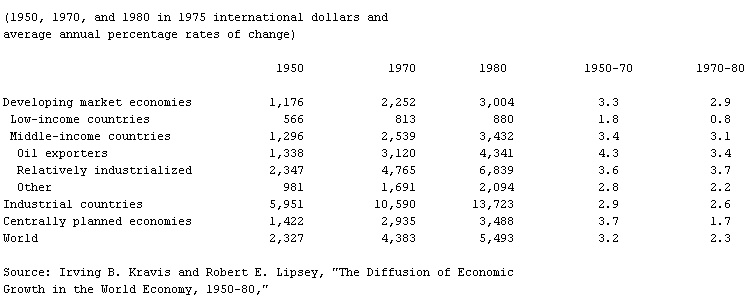 International Comparisons of
International Comparisons of Productivity and Causes of the Slowdown, ed. by John W. Kendrick (1984),
Table 3-A3, p. 145. The 1980 estimates assume that labour force participation
ratios in 1980 were the same as in 1975. Reprinted with the permission of
The American Enterprise Institute for Public Policy Research, Washington, D.C.

- Bengbu
- Bengel, J A
- Bengkalis Island
- Bengkulu
- Bengt Gabrielsson, Greve Oxenstierna
- Bengt Gabrielsson Oxenstierna, Greve
- Bengt Ingemar Samuelsson
- Bengt Lidner
- Bengtsson, Frans Gunnar
- Bengt Strömgren
- Benguela
- Benguela Current
- Ben-Gurion, David
- Ben-hadad I
- Ben Hecht
- Ben Hogan
- Beni Abbès
- Beniamino Gigli
- beni-e
- Benigni, Roberto
- Benigno Simeon Aquino, Jr.
- Benigno Simeon, Jr. Aquino
- Beni Hasan
- Beni Isguene
- Beni Mellal