Selected Major World Stock Market Indexes 5
Table
Percent
2002 range2 Year-end change from
Country and Index High Low close 12/31/2001
Australia, Sydney All Ordinaries 3440 2856 2976 -11
Belgium, Brussels BEL20 2900 1774 2025 -27
Brazil, Bovespa 14,471 8371 11,268 -17
Canada, Toronto Composite 7958 5695 6615 -14
Denmark, KFX 279 187 199 -27
Finland, HEX General 9036 4820 5775 -34
France, Paris CAC 40 4688 2656 3064 -34
Germany, Frankfurt Xetra DAX 5463 2598 2893 -44
Hong Kong, Hang Seng 11,975 8859 9321 -18
Ireland, ISEQ Overall 5665 3620 3995 -30
Italy, Milan Banca Comm. Ital. 1513 974 1092 -24
Japan, Nikkei Average 11,980 8303 8579 -19
Mexico, IPC 7574 5534 6127 -4
Netherlands, The, CBS All Share 745 424 462 -35
Philippines, Manila Composite 1469 998 1018 -13
Singapore, SES All-Singapore 478 346 349 -18
South Africa, Johannesburg All Share 11,653 8871 9277 -11
South Korea, Composite Index 938 584 628 -10
Spain, Madrid Stock Exchange 848 569 634 -23
Switzerland, SPI General 4615 3096 3246 -26
Taiwan, Weighted Price 6462 3850 4452 -20
Thailand, Bangkok SET 426 305 356 17
United Kingdom, FTSE 100 5324 3671 3940 -24
United States, Dow Jones Industrials 10,635 7286 8342 -17
United States, Nasdaq Composite 2059 1114 1336 -31
United States, NYSE Composite 610 421 473 -20
United States, Russell 2000 523 327 383 -22
United States, S&P 500 1173 777 880 -23
World, MS Capital International 1031 704 784 -22
See as table: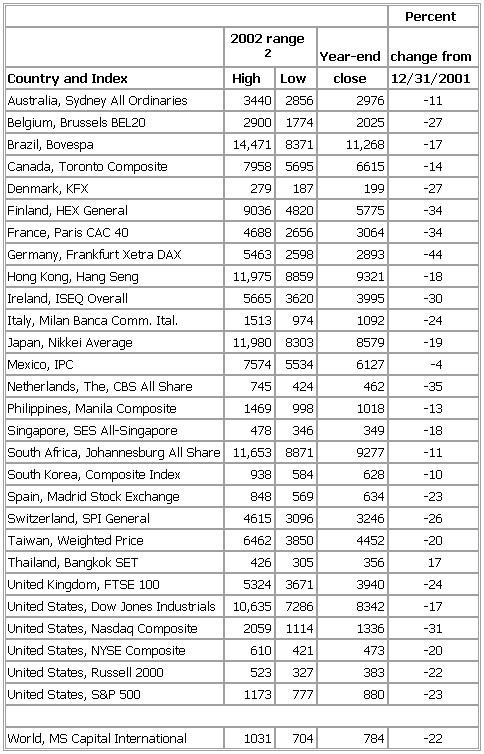
1Index numbers are rounded.
2Based on daily closing price.
Sources: Financial Times, The Wall Street Journal.
- Warren, Joseph
- Warren, J. Robin
- Warren, Leonard
- Warren, Mercy Otis
- Warren, Rick
- Warren, Robert Penn
- Warrensburg
- Warren Spahn
- Warren Wright
- Warri
- Warring States
- Warrington
- Warriston, Archibald Johnston, Lord
- Warrnambool
- Warrumbungle Range
- Warsaw
- Warsaw, Compact of
- Warsaw, Duchy of
- Warsaw Ghetto Uprising
- Warsaw Pact
- Warsaw Uprising
- Wars of the Roses
- Wars of the Vendée
- Wars of Yahweh, Book of the
- wart