World Green Coffee Production, Table 3
Table
Table VIII. World Green Coffee Production
In 000,000 60-kg bags
Region and country 1995-96 1996-971 1997-982
North America 19.5 19.8 20.7
Costa Rica 2.6 2.3 2.4
El Salvador 2.3 2.4 2.6
Guatemala 3.8 4.1 4.2
Honduras 2.3 2.4 2.6
Mexico 5.5 5.6 5.7
South America 34.7 42.2 44.3
Brazil 16.8 27.5 28.0
Colombia 12.9 0.3 11.3
Ecuador 1.9 1.8 1.9
Peru 1.8 1.5 1.8
Africa 18.2 19.8 19.5
Cameroon 1.0 1.0 1.0
Côte d'Ivoire 2.9 4.7 3.8
Ethiopia 3.8 4.0 4.0
Kenya 1.6 1.3 1.7
Uganda 4.2 4.0 4.0
Zaire 1.0 0.9 1.0
Asia and Oceania 16.8 19.0 19.2
India 3.7 3.4 3.8
Indonesia 5.8 7.6 6.8
Thailand 1.3 1.3 1.2
Vietnam 3.6 4.2 5.0
Total production 89.2 100.7 103.7
Exportable 65.5 76.3 78.1
Beginning stocks 40.8 32.1 26.0
Exports3 74.7 82.9 84.4
See as table: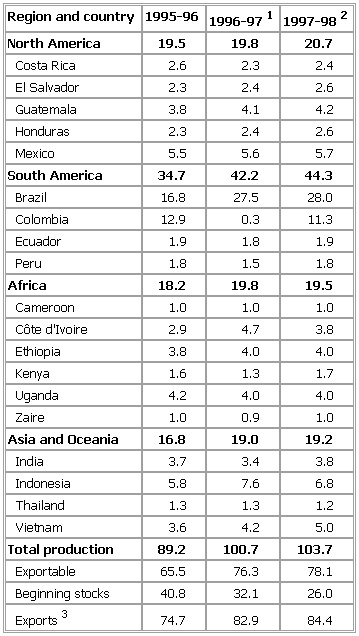
1Preliminary.
2Forecast.
3By exporting countries.
Source: USDA, June 1997.
- Roon, Albrecht Theodor Emil, Graf von
- Rooney, Mickey
- Roosa, Stuart A.
- Roosendaal
- Roosevelt, Edith
- Roosevelt, Eleanor
- Roosevelt, Franklin D.
- Roosevelt Island
- Roosevelt, Theodore
- Roosevelt University
- Roos, S.H. de
- roosterfish
- root
- root and pattern system
- Root, Elihu
- Root, John Wellborn
- root pressure
- Root-Takahira Agreement
- Ropar
- rope
- Roper, Elmo
- Roper River
- Rops, Félicien
- Roquefort
- Roque Sáenz Peña