Real Gross Domestic Products of Selected OECD Countries, Table
Table
% annual change
Country 1991 1992 1993 1994 1995{1}
United States -0.6 2.3 3.1 4.1 2.5
Japan 4.3 1.1 -0.2 0.6 0.5
Germany{2} 5.0 2.2 -1.2 2.9 2.5
France 0.8 1.3 -1.5 2.7 2.4
United Kingdom -2.0 -0.5 2.2 3.8 2.5
Canada -1.8 0.6 2.2 4.5 3.2
Italy 1.2 0.7 -1.2 2.2 2.6
All developed countries 1.0 1.7 1.2 2.9 2.5
Seven major countries above 1.0 1.6 1.3 3.0 2.7
European Union 1.6 1.0 -0.6 2.7 2.5
{1}Estimated. {2}From 1991, figures include former East Germany.
Sources: OECD, 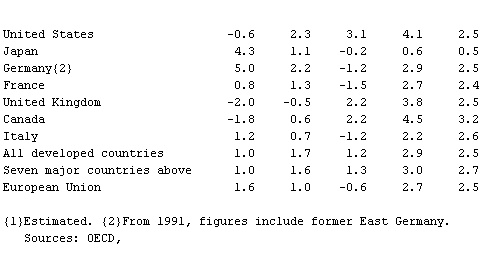 The Economist.
The Economist. - Hortensia
- Hortensius Hortalus, Quintus
- Hortensius, Quintus
- Hort, Fenton J A
- Horthy, Miklós
- horticulture
- Horton, George Moses
- Horton, Robert E
- Horus
- Horvitz, H. Robert
- Horváth, Ödön Edmund Josef von
- Ho Ryong
- Hosayn Fatemi
- hose
- Hosea Ballou
- Hosea, Book of
- Hoshangabad
- Hoshea
- Hoshiarpur
- hosiery
- Hosius Of Córdoba
- Hosius, Stanislaus
- Hoskyns, Sir Edwyn Clement, 13th Baronet
- Hosmer, Harriet Goodhue
- Hosnī Mubārak